
Organizing a conference is not easy, and it requires that a lot of tasks will be completed on time. Those tasks can take minutes or weeks, and might depend on other tasks that must be completed beforehand. Keeping track and managing everything requires a lot of attention, and is almost impossible to achieve without a good tracking system. In addition, the organization process requires getting and providing information to and from attendees, which in turn require some forms or spreadsheets.
If you ever organized a conference, you probably have a bunch of such documents that were passed on to you by someone else, that need to be adapted to your new needs. To help with that, Yuval and Alex
created the Europe – East Conference Organization Toolkit.
The toolkit is a Google Drive folder that contains forms and spreadsheets that can help you during the organization process. To use the toolkit, just copy the files you need to your own Google Drive (or download them), edit them with data relevant to your conference, and follow the instructions.
The toolkit contains seven files at the moment. You might not need all of them, or you might need something that isn’t there. You can simply ignore anything you don’t need, and you can send us an email if there’s something you’re missing, or if you need some help editing and using any of the files!
Conference Task Tracking
This is by far the most important spreadsheet in the toolkit. The task tracking spreadsheet is derived from the spreadsheet provided by the Conference Sphere, with some changes. To make the tracker more user friendly, we added a lot of color coding. Completed tasks appear in green and delayed tasks in red. If a task isn’t needed (choosing a L2 testing coordinator for a conference with no L2 testers, for example), it can be set to “not applicable” and it get’s greyed out. Some tasks were also bunched up together or reworded, since they changed since the tracker was first introduced.
Using the spreadsheet is very simple: set the date in the first sheet, and update your progress on the second. The first sheet will also hold some presentation data, and it contains more detailed instructions. The rule of thumb is “try keeping your tasks in the green, and avoid the red”.
Presenter Application Form
A conference without presenters is a conference not worth having, so getting some presenters is highly encouraged. A link to fill this form can be published to all possible attendees so they can apply as presenters in your conference. Once the application deadline is reached, look at the answers and choose the most suitable presenters. The form comes with a long and detailed list of potential topics, but you can freely add or remove any topics you like.
Before publishing this form, a few edits are required. You can edit your copy in any way you like, but make sure you don’t leave any edit tags behind (edit tags appear in the form of <TAG>). In its current form, the tags that require editing are:
- Conference Name: add the name of your conference to the title
- Name: add it to the description as well
- Presentation Application Deadline: people need to know the deadline for application
- Presentation Application Deadline + 1 week: this the time by which you’ll tell the presenters that were selected what they’ll be presenting
Seminar Schedule
This spreadsheet doesn’t do much, except creating a nice to read schedule. Once you know who is presenting what and when, fill out the data in the relevant places. Like the presenter’s application form, this has a bunch of tags:
- Start/End: the start time and end time of each presentation
- Level: the level towards the presentation is aimed (not the presenter’s level)
- Seminar Name: people need to know what they’re getting, don’t they?
- Presenter: who will be presenting
Once all the details are in, you can simply take a screenshot and crop the image (or use Windows’ Snipping Tool) to get something like this: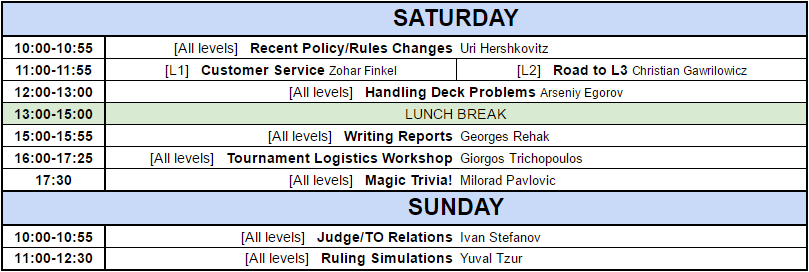
Room Allocation
This spreadsheet is very simple. Update the number of rooms you have of each size by adding or removing rows to the relevant section, and have people add their names next to their friend’s. The only thing that’s important to remember is that the sharing link is set to “view” by default, so you need to change it to “edit”.
Flight Schedule
This one is similar in functionality to the room allocation spreadsheet. Give the link to people and let them fill out their flight details. To add some functionality, you can add a new topic to the event forum on JudgeApps with the link on the opening post and let people discuss meeting up and travel arrangements from the airport to the venue.
Conference Feedback Form
Once your conference is done, you would probably like to get some feedback. To do so, copy this form and edit it to match your presentations. This one is similar to the presenter’s application, but has an extra step: before editing all the tags (which we’ll detail in a moment), make sure to copy the last section (Section 5) to match the number of seminars that will be presented throughout the conference.
As promised, here are the tags, and what they represent:
- Conference Name: add the name of your conference to the title
- Replace this section with a relevant image: do what it says 🙂
- Seminar Name: replace with the seminar name (you should have one of these for each seminar after you copy it as mentioned above)
- Presenter: replace with the name of the presenter (again, once per seminar)
- L1/L2+/all levels: choose one, depending on the level the seminar was aimed at
Presentation Score Calculator
This one is the most complicated of the bunch, and isn’t really required if it feels too technical. The goal of this spreadsheet is to provide some statistical data about presenter performance.
The calculator assumes you used the feedback form provided as part of the toolkit. If you used some other way to get feedback, or edited the presenter feedback categories, more editing will be required, and filling the spreadsheet by copy-pasting the results from the form might not work properly.
To get your statistics, start by deleting the example sheets and removing them from the “Summary” sheet. Now copy the “Template” sheet once for each seminar, and edit its name to match. In each of these sheets, fill out the scores for the different categories (if you used the feedback form provided by the toolkit and exported the results to a spreadsheet, a simple copy-paste should be possible). Once all the scores are filled up, it’s time to fill the “Summary” sheet. To do so, add the seminar names to the “Presentation” column (it must match the name of the relevant sheet exactly), and the presenter name next to it. When all is done, you should have all the scores and averages by presenter and by category, and the rank of each presenter relative to the others. If a presenter was way above or below average in a specific category, it’ll be colored in green or red respectively.
We hope this toolkit will make the process of organizing your next conference easier, and will allow you to invest your energy where it counts – making a great conference!